
Learning path
Data Analytics Learning Path
Finance and accounting are changing fast, and data skills are now part of the job. Employers want professionals who can analyze data, automate reporting and make better decisions. This path builds those skills — statistics, SQL, Python, Power BI and automation — on finance and accounting examples.
7 courses·39 NASBA CPE
All seven courses are included with every paid plan. Compare plans
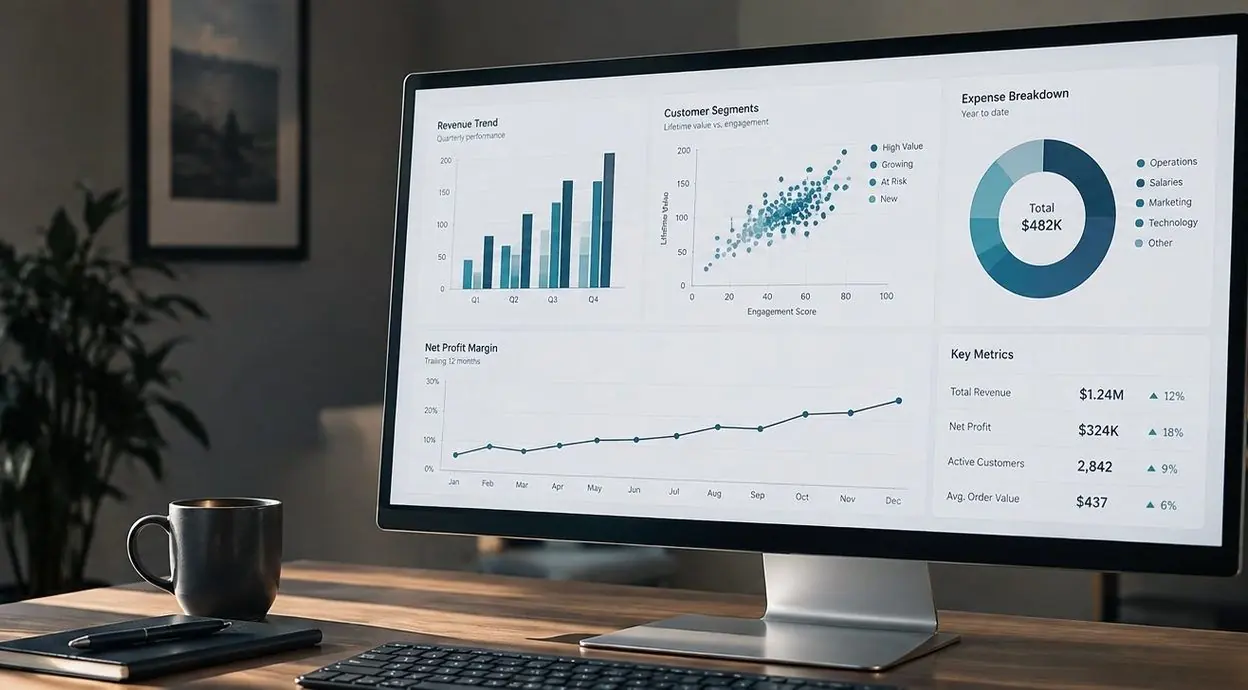
Data skills are now part of the finance job.
The reporting is bigger, the systems hold more of it, and the people asking for answers expect them sooner. Three things are now expected of the accountant in the room:
Analyze the data yourself
Query the database, describe the dataset and test the relationship — without waiting on IT for an extract.
Stats · SQL · ExcelAutomate the reporting
Hand the recurring workbook to a macro or a script, and spend the hours on the review instead.
VBA · PythonMake the decision visible
Turn the result into a dashboard that a manager reads in a minute and acts on.
Power BI · Excel dashboardsEvery lesson is built around real financial scenarios, so the skill transfers to Monday’s work.
Your complete learning journey.
Seven courses in three stages: learn to read the data, learn to get it and automate it, then analyze and report it. Each course earns its own NASBA CPE, so you can start at the top or go straight to the one you need.
How analysis works, the statistics behind it, and Excel at a level you can build on.

Intro to Data Analytics
Descriptive, predictive and prescriptive analytics, the trends and patterns to look for in financial data, and how to ask the question that drives the analysis.
Statistics
Stats for Data Analytics
Descriptive and inferential statistics, correlation and regression, applied to real datasets so you can read a trend and defend the conclusion.
Statistics
Microsoft Excel Bootcamp
The functions and formulas that clean, structure and summarize a dataset — VLOOKUP, SUMIFS and the techniques that cut the manual steps.
Computer Software & ApplicationsPull it out of the database yourself, then hand the recurring workbook to a macro.

SQL for Data Analytics
From a first query to filtering, aggregation and analysis, so you can pull the data out of the database yourself instead of waiting on someone else for it.
Computer Software & ApplicationsMicrosoft Excel VBA Macros
Write the macros that take the repetitive work out of a recurring workbook, and automate almost any process in Excel.
Computer Software & ApplicationsScripted analysis for the questions a grid cannot answer, and a dashboard people act on.

Python Bootcamp for Finance and Accounting
No coding experience assumed. Import, clean and analyze data in a Jupyter notebook, and automate the steps you repeat every close.
Computer Software & Applications
Excel Dashboards + Power BI
Choose the metrics, structure the data, and build interactive dashboards — first in Excel, then in Power BI.
Computer Software & ApplicationsWhat you will be able to do, and who it is for.
By the end of the path
- Pull, filter and aggregate your own data with SQL
- Clean and structure a dataset in Excel with lookups and SUMIFS
- Describe a dataset and test a relationship with correlation and regression
- Automate a recurring workbook with VBA macros
- Import, clean and analyze data in Python, in a Jupyter notebook
- Build interactive dashboards in Excel and Power BI
Who should enroll
- Finance and accounting professionals who need SQL, Power BI or Python to advance
- Career changers looking to break into data-driven finance roles
- Anyone feeling stuck in their career and wanting an edge in the job market
No prior data or coding experience needed. The path starts at the fundamentals and builds from there.
Move your career ahead with the Data Analytics Learning Path.
- Seven courses, from statistics to Power BI
- 39 NASBA CPE across the path
- Finance and accounting examples throughout
- Learn at your own pace — every course stands on its own
All seven courses are included with every paid plan. Compare plans